Sensu Plus
COMMERCIAL FEATURE: Access Sensu Plus in the packaged Sensu Go distribution. For more information, read Get started with commercial features.
Sensu Plus is a built-in integration for transmitting your Sensu observability data to the Sumo Logic Continuous Intelligence Platform™ via a Sumo Logic HTTP Logs and Metrics Source (an endpoint for receiving data). In Sumo Logic, you can configure customized interactive dashboards and analytics tools to gain better visibility into your Sensu data — read Introducing Sensu Plus for more information.
If you completed Sumo Logic setup in the Sensu web UI, finish the configuration process to create the Sensu resources you need to start sending observability event data to Sumo Logic.
If you did not use the Sensu web UI to set up a Sumo Logic account, follow the manual setup process for Sensu Plus.
Finish configuration after web UI setup
In the Sensu web UI, you already set up a Sumo Logic account and HTTP Logs and Metrics Source endpoint for receiving data. To finish your configuration, you need the SOURCE URL for your endpoint, which you can copy from the last page in the web UI dialog.
Follow the steps in this section to create a Sensu handler, pipeline, and check to transmit your Sensu data in Sumo Logic.
Create a handler in Sensu
Create a Sumo Logic metrics handler to send your Sensu observability data to your new Sumo Logic HTTP Logs and Metrics Source. Sumo Logic metrics handlers provide a persistent connection to transmit Sensu observability data, which helps prevent the data bottlenecks you may experience with traditional handlers.
NOTE: Sumo Logic metrics handlers only accept metrics events. To send status events, use the Sensu Sumo Logic Handler integration instead.
For a Sumo Logic metrics handler, the resource definition must use the URL for your HTTP Logs and Metrics Source as the value for the url attribute.
Here is an example Sumo Logic Metrics Handler definition.
Before you run the command to add this handler, replace the url example value with the URL for your Sumo Logic HTTP Logs and Metrics Source:
cat << EOF | sensuctl create
---
type: SumoLogicMetricsHandler
api_version: pipeline/v1
metadata:
  name: sumo_logic_http_metrics
spec:
  url: "https://collectors.sumologic.com/receiver/v1/http/xxxxxxxx"
  max_connections: 10
  timeout: 10s
EOF
cat << EOF | sensuctl create
{
"type": "SumoLogicMetricsHandler",
"api_version": "pipeline/v1",
"metadata": {
"name": "sumo_logic_http_metrics"
},
"spec": {
"url": "https://collectors.sumologic.com/receiver/v1/http/xxxxxxxx",
"max_connections": 10,
"timeout": "10s"
}
}
EOFIf you prefer, you can configure your Sumo Logic HTTP Logs and Metrics Source URL as a secret with Sensu’s Env secrets provider to avoid exposing the URL in your handler definition.
This example shows the same definition with the URL referenced as a secret instead:
cat << EOF | sensuctl create
---
type: SumoLogicMetricsHandler
api_version: pipeline/v1
metadata:
  name: sumo_logic_http_metrics
spec:
  url: $SUMO_LOGIC_SOURCE_URL
  secrets:
  - name: SUMO_LOGIC_SOURCE_URL
    secret: sumologic_metrics_us1
  max_connections: 10
  timeout: 10s
EOF
cat << EOF | sensuctl create
{
"type": "SumoLogicMetricsHandler",
"api_version": "pipeline/v1",
"metadata": {
"name": "sumo_logic_http_metrics"
},
"spec": {
"url": "$SUMO_LOGIC_SOURCE_URL",
"secrets": [
{
"name": "SUMO_LOGIC_SOURCE_URL",
"secret": "sumologic_metrics_us1"
}
],
"max_connections": 10,
"timeout": "10s"
}
}
EOFConfigure a pipeline
Sensu pipelines use event filters, mutators, and handlers as the building blocks for event processing workflows. With your handler definition configured, you’re ready to create a pipeline with a workflow that references your sumo_logic_http_metrics handler.
To configure event processing via your sumo_logic_http_metrics handler, add this example pipeline definition. This pipeline includes a workflow with your sumo_logic_http_metrics handler, along with Sensu’s built-in has_metrics event filter to ensure that the workflow only processes events that contain metrics:
cat << EOF | sensuctl create
---
type: Pipeline
api_version: core/v2
metadata:
  name: sensu_to_sumo
spec:
  workflows:
  - name: metrics_to_sumologic
    filters:
    - name: has_metrics
      type: EventFilter
      api_version: core/v2
    handler:
      name: sumo_logic_http_metrics
      type: SumoLogicMetricsHandler
      api_version: pipeline/v1
EOF
cat << EOF | sensuctl create
{
"type": "Pipeline",
"api_version": "core/v2",
"metadata": {
"name": "sensu_to_sumo"
},
"spec": {
"workflows": [
{
"name": "metrics_to_sumologic",
"filters": [
{
"name": "has_metrics",
"type": "EventFilter",
"api_version": "core/v2"
}
],
"handler": {
"name": "sumo_logic_http_metrics",
"type": "SumoLogicMetricsHandler",
"api_version": "pipeline/v1"
}
}
]
}
}
EOFAdd a Sensu check
Your pipeline resource is now properly configured, but it’s not processing any events because no Sensu checks are sending events to it. To get your Sensu observability data flowing through the new pipeline, add the pipeline by reference in at least one check definition.
This example check definition uses the sensu/system-check dynamic runtime asset. Dynamic runtime assets are shareable, reusable packages that make it easier to deploy Sensu plugins.
Follow these steps to configure the required system check:
-
Add the sensu/system-check dynamic runtime asset:
sensuctl asset add sensu/system-check:0.1.1 -r system-check -
Update at least one Sensu entity to use the
systemsubscription. In the following command, replace<ENTITY_NAME>with the name of the entity on your system. Then, run:sensuctl entity update <ENTITY_NAME>- For
Entity Class, press enter. - For
Subscriptions, typesystemand press enter.
- For
-
Add the following check definition:
cat << EOF | sensuctl create
---
type: CheckConfig
api_version: core/v2
metadata:
  name: system-check
spec:
  command: system-check
  runtime_assets:
  - system-check
  subscriptions:
  - system
  interval: 10
  timeout: 5
  publish: true
  pipelines:
  - type: Pipeline
    api_version: core/v2
    name: sensu_to_sumo
  output_metric_format: prometheus_text
  output_metric_tags:
  - name: entity
    value: "{{ .name }}"
  - name: namespace
    value: "{{ .namespace }}"
  - name: os
    value: "{{ .system.os }}"
  - name: platform
    value: "{{ .system.platform }}"
EOF
cat << EOF | sensuctl create { "type": "CheckConfig", "api_version": "core/v2", "metadata": { "name": "system-check" }, "spec": { "command": "system-check", "runtime_assets": [ "system-check" ], "subscriptions": [ "system" ], "interval": 10, "timeout": 5, "publish": true, "pipelines": [ { "type": "Pipeline", "api_version": "core/v2", "name": "sensu_to_sumo" } ], "output_metric_format": "prometheus_text", "output_metric_tags": [ { "name": "entity", "value": "{{ .name }}" }, { "name": "namespace", "value": "{{ .namespace }}" }, { "name": "os", "value": "{{ .system.os }}" }, { "name": "platform", "value": "{{ .system.platform }}" } ] } } EOF
This check will collect baseline system metrics in Prometheus format for all entities that include the system subscription and send the events to Sumo Logic via your sensu_to_sumo pipeline resource.
NOTE: Sumo Logic metrics handlers only accept metrics events, so you must use a check that produces metrics. If your check produces status events, use the Sensu Sumo Logic Handler integration to create a traditional Sensu handler rather than the Sumo Logic metrics handler.
View your Sensu data in Sumo Logic
During the web UI setup process, Sensu added two custom dashboards as a starting point for viewing your observability event data. The two new dashboards will be listed in the Sensu folder in the left-navigation menu:
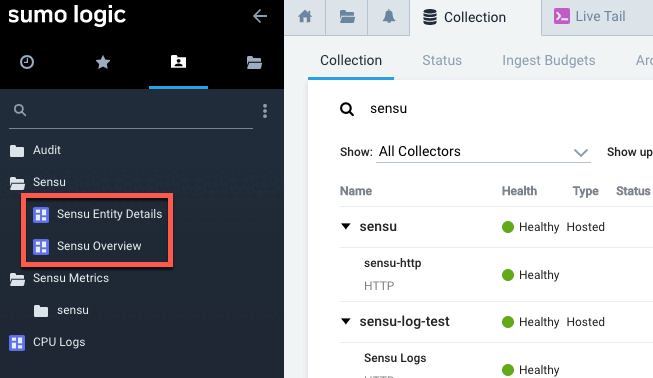
Click a dashboard name to view your Sensu observability data.
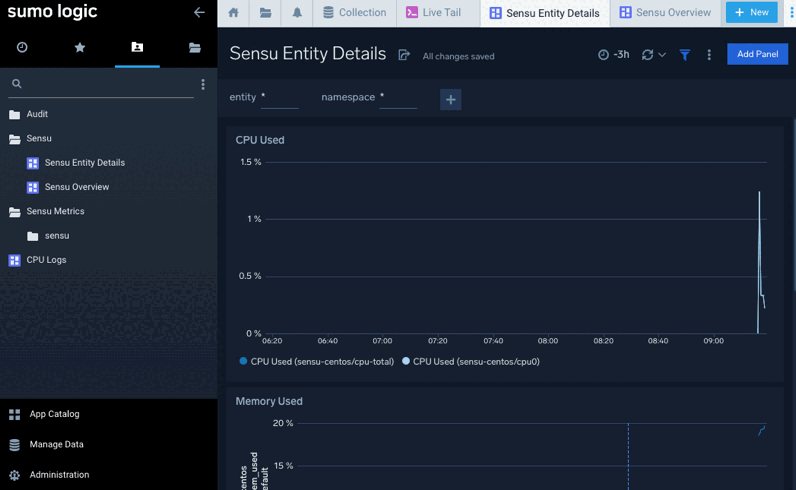
It may take a few moments for your data to appear in Sumo Logic. The Sensu Overview and Sensu Entity Details dashboards will begin to display your data:
Manually set up Sensu Plus
This section explains how to set up Sensu Plus manually, without using the Sensu web UI.
First, create a new Sumo Logic account or log in to your existing account.
Then follow the steps below to create a Sumo Logic HTTP Logs and Metrics Source (an endpoint for receiving data), the Sensu resources that collect and process the data, and two dashboards for viewing your observability event data in Sumo Logic.
Set up an HTTP Logs and Metrics Source
Create a Sumo Logic HTTP Logs and Metrics Source to collect your Sensu observability data:
-
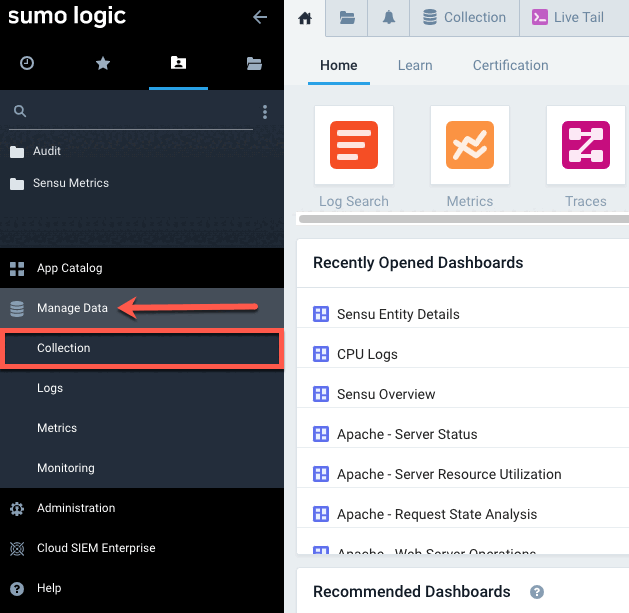
In the Sumo Logic left-navigation menu, click Manage Data and then Collection.
-
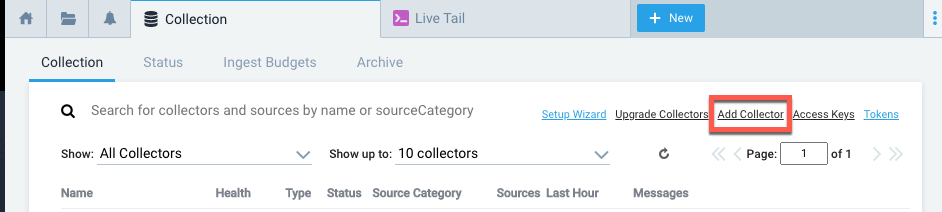
At the top-right of the Collection tab, click Add Collector.
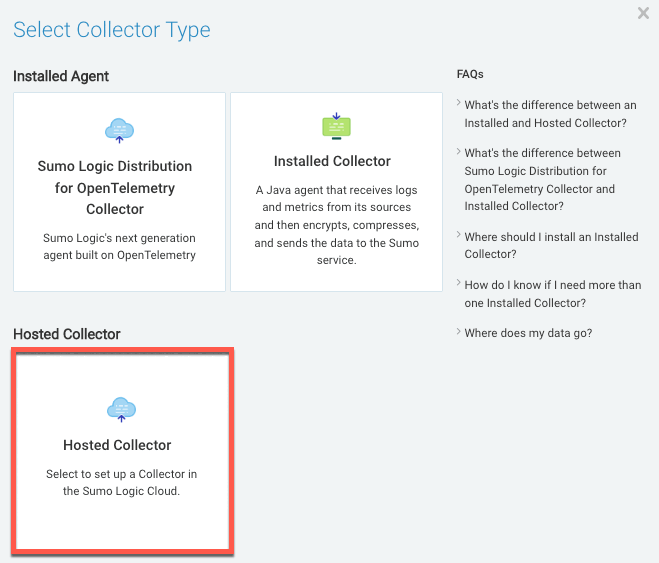
-
In the Click Selector Type modal window, click Hosted Collector.
-
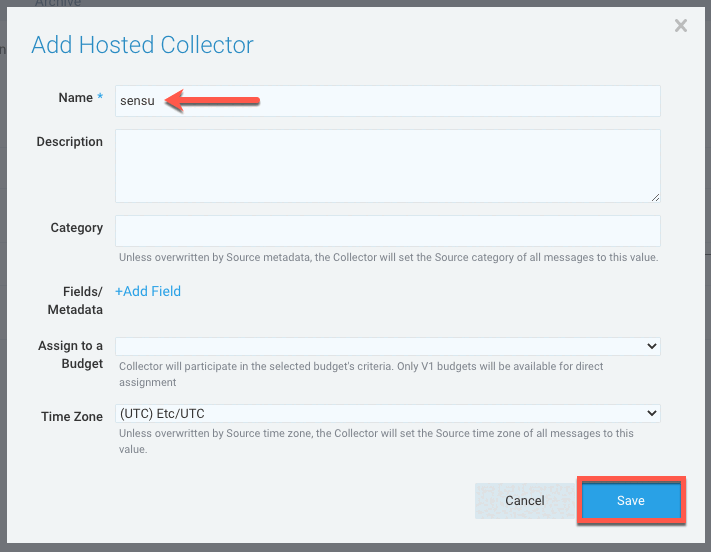
In the Add Hosted Collector modal window:
- Type sensu in the Name field.
- Click Save.
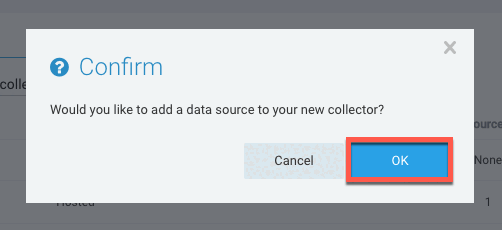
-
In the Confirm prompt, click OK.
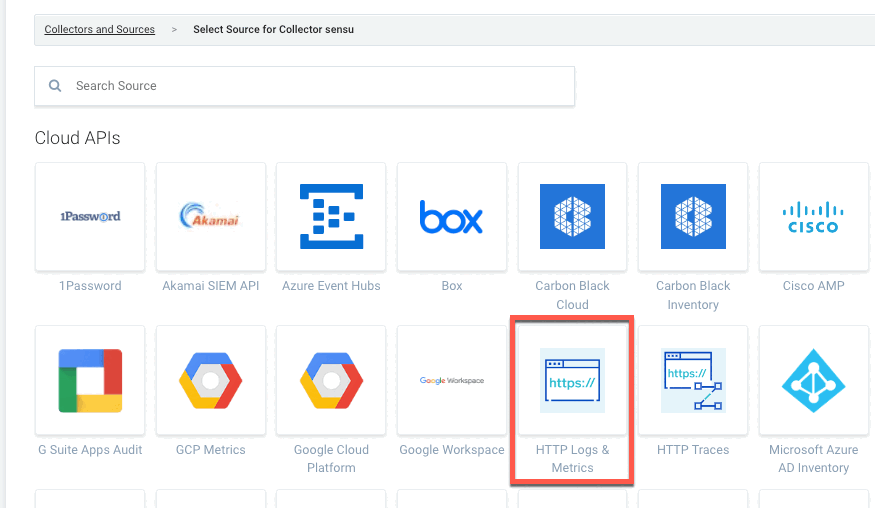
-
Under Cloud APIs, click HTTP Logs & Metrics.
-
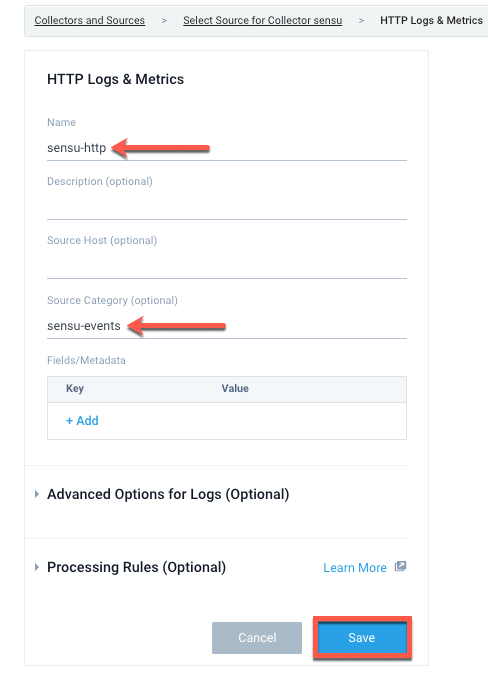
In the HTTP Logs & Metrics form:
- Type sensu-http in the Name field.
- Type sensu-events in the Source Category field.
- Click Save.
-
In the HTTP Source Address prompt, copy the listed URL and click OK. You will use this URL as the value for the
urlattribute in your Sensu handler definition.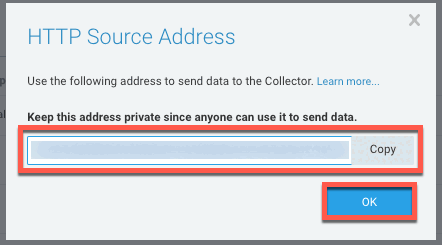
Import Sumo Logic dashboards
To view your Sensu observability data in Sumo Logic, you can configure Sumo Logic dashboards in any way you wish. As a starting point, follow these instructions to import two dashboards, Sensu Overview and Sensu Entity Details:
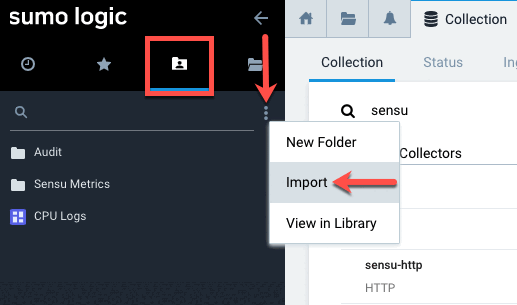
-
On your Sumo Logic home page, click the Personal tab in the left-navigation menu. Click the options icon for the folder where you want to import your Sensu data and select Import.
-
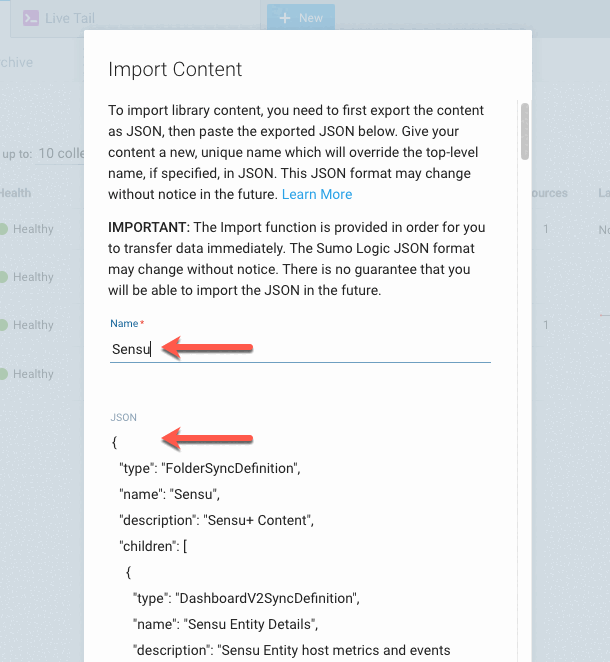
In the Import Content modal window:
- Type “Sensu” in the Name field.
- Copy the dashboard configuration JSON (download) and paste it into the JSON field:
-
Scroll to the bottom of the Import Content modal window and click Import. The two new dashboards will be listed in the Sensu folder in the left-navigation menu:
After you create a Sensu handler, pipeline, and check in the next section, you will be able to click a dashboard name to view your Sensu observability data.
Create Sensu resources
With your dashboards set up, you’re ready to configure a Sensu handler, pipeline, and check. To create the Sensu resources, follow the same instructions as users who started in the web UI:
After you add the check, it may take a few moments for your data to appear in Sumo Logic. The Sensu Overview and Sensu Entity Details dashboards will begin to display your data: